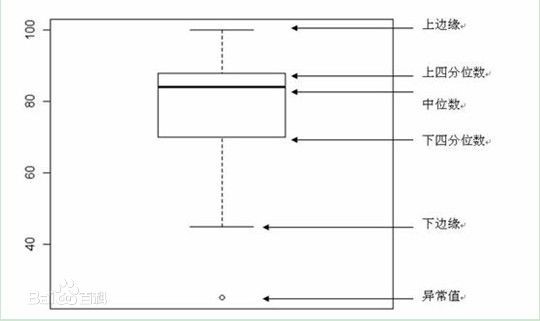
箱形图(Box-plot)又称为盒须图、盒式图或箱线图,是一种用作显示一组数据分散情况资料的统计图。
展现数据分布情况,给出分位点,将异常点剥离出来。
> a<-boxplot(Insurance$Claims,main="")
> a$stats
     [,1]
[1,]    0
[2,]    9
[3,]   22
[4,]   58
[5,]  102
attr(,"class")

"integer"